In our post Output noise versus System Knowledge, we discussed the importance of distinguishing between the stability of a system and the volatility of its output. The obvious next question is to understand what makes a system stable versus unstable. A starting point for this is to classify the different systems involved.
Investment Systems
In any systems analysis, we need to distinguish which actual system we are talking about. In The Fifth Discipline, Peter Senge notes:
Seeing “whole elephants” does not mean that every organizational issue can be understood only by looking at the entire organization. Some issues can be understood only by looking at how major functions such as manufacturing, marketing, and research interact; but there are other issues where critical systemic forces arise within a given functional area; and others where the dynamics of an entire industry must be considered. The key principle, called the “principle of the system boundary,” is that the interactions that must be examined are those most important to the issue at hand, regardless of parochial organizational boundaries.
For the equity analysts, there are generally three inter-related systems that need examining:
- The Asset System – this is the underlying business.
- The Company System – this is a collection of underlying businesses with a particular financial structure and controlled by a management team.
- The Share Price System – This is a representation of the company system, but one that is not perfect.
The key point is that the stability of each system may be different and this stability may be a function of the other systems.
Example – The Toll Road System of Transurban ($TCL AU).
The Asset System
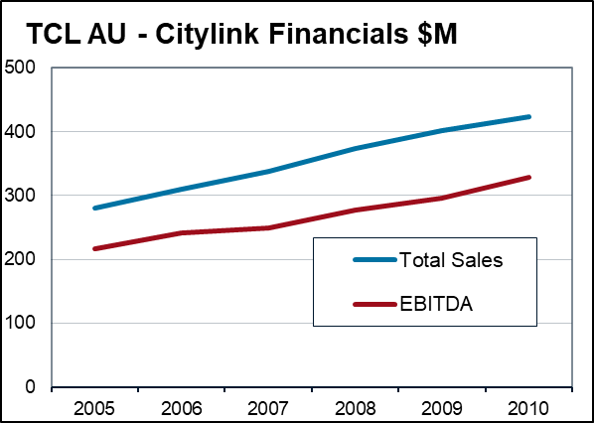
As an asset, toll roads are generally very stable. They are usually very difficult to replicate, have pricing structures that are often regulated, and demand swings in relation to economic fluctuations are generally at the margin.
For example, the Citylink toll road in Melbourne, owned by Transurban, delivered strong and stable financial performance throughout the GFC.
The Business System
However, the toll road business of Transurban, was much less stable than the Citylink toll road asset.
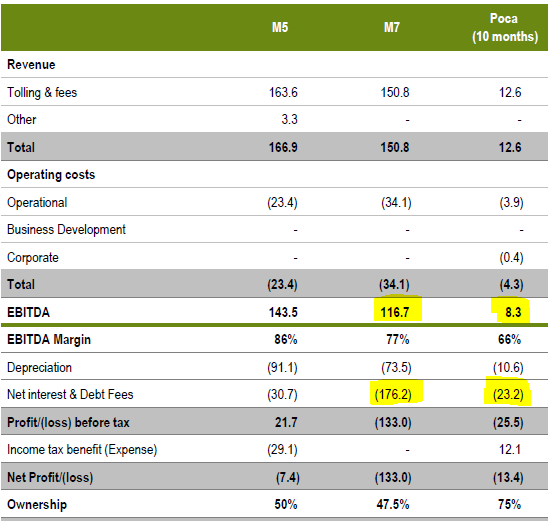
Firstly, the stable enterprise cash flows of the asset had been heavily leveraged at the corporate level. Therefore small changes to future asset cash flows would be material for the actual cash flows to equity holders. e.g. certain assets had interest expense well in excess of current cash flows.
Secondly, group management were incentivised to make acquisitions, thus adding another layer of potential instability to existing asset values. For example in FY06 the group made ~A$800m in acquisitions against a then market capitalisation of <A$4bn.
The Share Price System
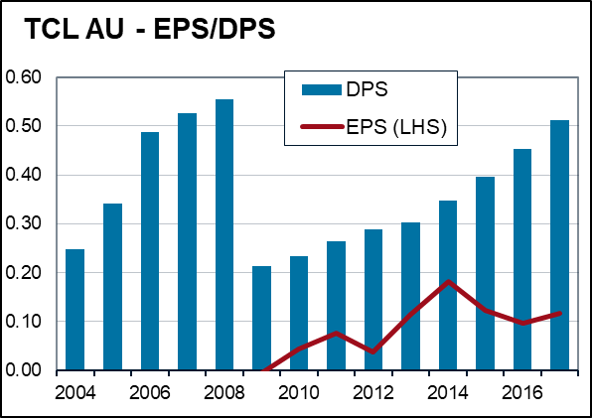
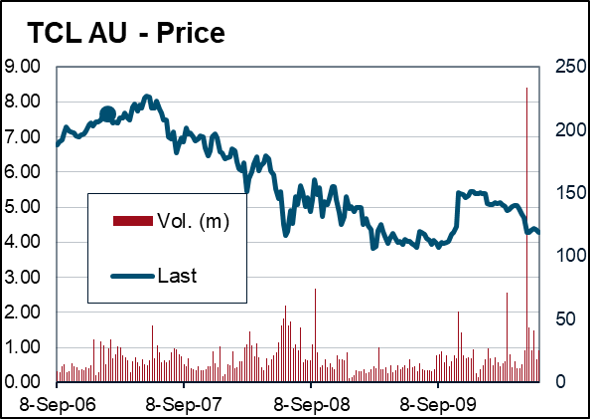
Finally, the share price system of the TCL stock, was much less stable than the Transurban business. An aggressive policy of paying more in dividends than was sustainable from free cash flow had boosted the share price. This policy was abanonded during the GFC with the dividend cut by more than half.
Not surprisingly, the share price halved. A stable utility asset system had been turned into a highly unstable share price system.
Stable vs Unstable Systems
Using this heirachy of asset/company/share price, we can look at some of the various factors that underpin stability.
Stable Asset System
Established product or industry (Lindy effect)
Diverse customer base
Diverse products
Diverse Suppliers
Broad value proposition
Unstable Asset System
New product or industry (Lindy effect)
Dominant customer
Single product
Single Suppliers
Narrow value proposition (e.g. legislative)
Whilst there is an overlap in some of these characteristics between a stable system and a good competitive position (a moat), they are different things. There are many monopolies that might be unstable – a single product that fails, a legislative monopoly that is revoked etc. Similarly many competive industries are quite stable, albeit with volatility. For example packaging returns are competitive but reasonably stable as companies and suppliers constantly trade off whether this function will be undertaken in house versus outsourced.
Stable Business System
Low leverage/net cash
Diverse business units
Boring managers
Positive Free Cash Flow
Unstable Business System
High leverage
Single Asset
Enterpreneurial management
Negative free cash flow
The biggest factor in business stability is financial leverage. This magnifies any shocks and creates both positive feedback loops. Again note the distinction between a good high returning business (traditionally associated with strong single purpose businesses) and the potential advantages to long term returns created by a diversified and more stable business stream. The entrepreneurial manager might also be on average a good thing, but this is not generally a characertistic that increases stability.
Stable Share Price
Stable Assets
Stable Business
Moderate valuation
Diverse shareholding structure
Diverse shareholder beliefs
Unstable Share Price
Unstable Assets
Unstable Business
Extreme Valuations
Concentrated shareholder structure
Polarised shareholding beliefs
As we have previously noted, the Share Price system relates to the Asset and Business systems, but this relationship is not perfect. Generally an unstable Asset or Business System will contribute to an unstable Share Price system, but not always. Valuation will be a key consideration in this mapping. As the Transurban example above higlights a very stable Asset mapped to a highly unstable Share Price due to a combination of financial leverage and an extreme valuation.
A key consideration in the instability of share prices is the polarisation of the existing and potential shareholder base. If beliefs are evenly distributed then share price moves will be cushioned even as the mean opinion changes. However, in situations where beliefs are polarised strongly between bull and bear cases, the transition between these two states (particularly bull to bear) can be sudden and dramatic.
Conclusion
Understanding the Systemic nature of the investment opportunity is a key analytical tool. A starting point is to distinguish between the stability of the underlying system and its volatility. One step in this process is to break down the systems being analysed into a classification of Asset/Business/Share Price.
In future posts we will look at other elements to consider in this analysis:
- What shock is that? – Distinguishing between different types of shocks and their impact on these systems;
- Where’s that System at? – Distinguishing the different states a system might be in.
- What feedback loop is that? – Understanding the various feedback loops that drive systemic behaviour.