
Earnings Quality Overview
When the numbers acquire the significance of language, they acquire the power to do all of the things which language can do: to become fiction and drama and poetry
- What is Earnings Quality?
- Why is Earnings Quality Useful?
- How do we analyse Earnings Quality?
- When is Earnings Quality Important?
What is Earnings Quality?
The true earnings of a business are represented by the concept of return on investment – the amount of cash out we receive in return for a given amount of cash in. As a result of history¹ we measure these numbers using double entry accrual accounting, however, a number of factors mean that any measurement system will be imperfect.
In its broadest sense, the term earnings quality describes how closely measured (reported) earnings match true earnings:
Reported Earnings (RE) = Accounting Function (f) of True Earnings (X); RE = f(X)
There are two components to this idea – how well do we understand True Earnings (X) and how good a job does our measuring system ‘f’ do of representing it. This leads to two common usages of the term “Earnings Quality” by practitioners:²
- The Composition of earnings – How well do we understand True Earnings? Are they annuity style or one off? High risk or low risk? Cyclical or defensive?
- The Representation of earnings – How good a job does f do of representing X?
Within the Equity Toolkit we will reserve the term Earnings Quality to refer to this second usage. How accurately do reported earnings represent the underlying economics of the business?
Obviously there is a chicken and egg situation here. We cannot know the quality of this Representation unless we first have an understanding of true earnings, including their composition. This understanding is gained through analysis of the operational and returns characteristics of the business. So whilst the Composition of Earnings is an important consideration of overall earnings quality, for the purposes of the Equity Toolkit we have considered these issues separately under the following topics: Operational Frame (composition of cash flows), Market frame (valuation) and Financial Frame (Measurement of Returns).
Two further semantic points are worth clarifying. Firstly, there is a tendency for the expression “bad earnings quality” to be reserved for situations of accounting fraud or breaches of accounting standards, with the corollary that compliance with such standards is acceptable. However, this fails to recognise that earnings quality falls on a continuum. Fraud might represent an extreme of this continuum, but many non fraudulent and compliant activities might still fall on the “bad” end of this spectrum. The overriding objective of analysis should be to consider where on the spectrum of representation reported earnings lie, not to simply understand compliance to standards.
The second point is the distinction between good and bad earnings quality. In the academic literature, these terms are used to define how good a job f is doing in representing X. However, amongst practitioners, these terms are generally used to refer to the direction (or bias) of the representation. So a reference to good earnings quality would reference a situation where reported earnings understate underlying business economics, whilst a reference to bad earnings quality would imply the reverse.³
Why is Earnings Quality Useful?
The crux of earnings quality analysis is as follows:
- Reported earnings represent an estimate of underlying performance.
- This estimate is subject to error and bias.
- These errors and biases are not properly understood and so represent opportunities for investors.
The source of these opportunities is that for a combination of behavioural4 and institutional reasons, investors tend to fixate on earnings rather than the statistical significance of these earnings. Practical experience tells us that this should offer investment opportunities and whilst the academic literature on earnings quality is vast and often conflicting, it demonstrates three broad ideas:
1. Companies deliberately manipulate earnings;
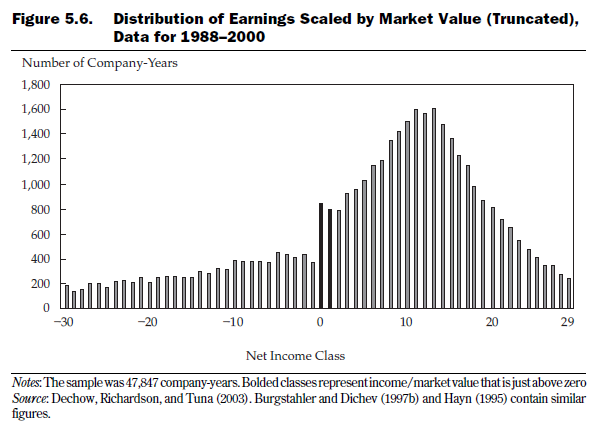
Anyone who has worked in finance for any length of time knows anecdotally that companies manipulate earnings. The incentives for this are varied, but the evidence from academic studies is reasonably robust. Distributions of reported earnings (whether absolute or relative to estimates) have a kink around zero – suggesting concerted efforts at the margin to boost reported profitability.
A number of studies have looked at the frequency of reported earnings numbers. The relevent information here is the large number of companies that report earnings at or just above zero relative to the small number of companies that report small losses. The interpretation is that companies manage earnings in order to report a profit rather than a loss.
Source: Dechow & Schrand, Earnings Quality, Research Foundation of CFA Institute.
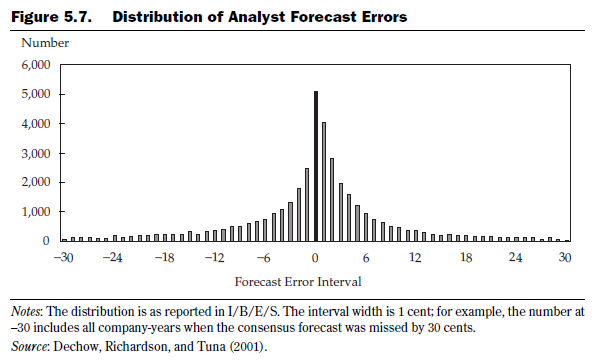
Rather than looking at absolute levels of earnings, other studies look at earnings relative to consensus estimates. Again, many more companies meet or just exceed estimate relative to those that just miss estimates, a possible interpretation of which is earnings management.
Source: Dechow & Schrand, Earnings Quality, Research Foundation of CFA Institute.
2. Earnings that have been manipulated (whether deliberately or inadvertently) are less persistent.
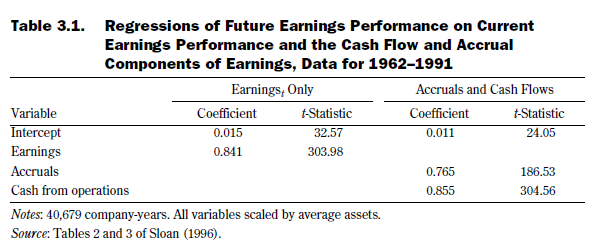
The classic study in this field was undertaken by Sloan (1) and involved two tests. The first was to understand the persistence of earnings and whether this persistence differed depending on whether the earnings were backed by cash or whether the earnings were backed by accruals (the subjective, easily manipulated component of earnings).
The results of this test were clearly in favour of cash backed earnings. For every dollar of earnings, 84c persisted into the following year. For earnings backed by cash, persistence was 86c, whilst for earnings backed by accruals, persistence was only 77c.
The persistence of earnings in this table are measured by the Coefficients – 0.841 (representing 84c in the dollar for earnings alone) and 0.765 and 0.865 when decomposed into Accrual and Cash Earnings respectively.
Source: Dechow and Schrand, Earnings Quality, Research Foundation of CFA Institute
3. Despite this, investors tend to value the real and made up earnings equally, thus presenting an opportunity for share price arbitrage.
The next step of Sloan’s study was to see whether investors appreciated this difference. The evidence was strong – ranking portfolios by their level of accruals (cash conversion of earnings) – low accrual portfolios strongly outperformed high accrual portfolios.
Sloane ranked companies into deciles based on their accruals. He then constructed theoretical portfolios that went long the top decile (i.e. lowest accruals) and short the bottom decile (highest accruals). The annual average abnormal returns from this strategy was roughly 10% p.a. with only two negative years. Note that these portfolios were priced 4 months after fiscal year end, so do not capture price movements on the release of the annual results.
Source: Sloane5

How do we analyse Earnings Quality?
Having determined that Earnings Quality analysis is useful – how do we undertake it?
There are four steps to this process:
1. Understand the “true” earnings of the business.
Involves understanding of both earnings composition and returns:
- Operational Frame (Composition of cash flows)
- Financial Frame (Measurement of Returns).
2. Consider the types of places where earnings quality is likely to arise
The broad idea is to start looking where the potential for earnings errors or manipulation is greatest. In an investigative sense, the best spots to look are those where:
- The Means exist for reported earnings to be wrong – where there is great subjectivity in the accounting rules.
- Motivation exists to manipulate earnings – eg Executive remuneration, capital raisings, IPO’s etc.
- Opportunity exists to manipulate earnings – certain industries or jurisdictions; certain times – acquisitions, interim results etc.
3. Utilise an Earnings Quality Framework to interpret Earnings Quality:
- Accruals – The starting point for earnings quality analysis is to understand accounting accruals, the difference between earnings and cash flow. By definition, these are the areas of accounting with the most subjectivity.
- Compliance – Are reported earnings compliant with the various accounting and regulatory standards under which they are prepared?
- Behavioural Proxies – Does company behaviour (e.g. serial acquisitions, presentation of pro-forma earnings) potentially indicate earnings quality issues, even if we can’t identify these specifically?
- Real World Due Diligence – Do we have external evidence that confirms or denies the validity of what is reported in the accounts . E.g. Asset values, problem contracts etc.
4. Chose an Earnings Quality Tool to undertake the analysis:
Within each Framework, there exist a multitude of specific tools that can be applied. But regardless of which framework is adopted, each earnings manipulation will ultimately be reflected in an accounting entry, even if this does not necessarily involve an accrual. Therefore, for convenience, it helps to understand the tools using a layout consistent with an Accruals Framework.
This gives rise to specific tools to examine the following areas:
- Sourcing and Measurment
- The P&L Accruals Framework
- Operating Cash Flow Conversion
- Revenue Recognition
- Gross Operating Cash Flow
- Working Capital
- Provisions
- Share Based Payments
- Superannuation
- Other Items
- Interest & Finance Costs
- Tax
- Associates and Related Parties
- Investing Cash Flow
- Internal Capex
- External Capex
- Acquisitions
- Operating Cash Flow Conversion
- Accruals and the Balance Sheet
- Where Accruals Fail
- Proving the Guilty Innocent
- Proving the Innocent Guilty
- Industry Specific Earnings Quality Issues
When is Earnings Quality important?
Like all analysis. Earnings Quality is not an end in and of itself. Good or bad earnings quality alone does not answer the question of good or bad investment, but is an input into our understanding of the system. The relevance and interpretation of earnings quality is always contextual to the question being asked.
For investors, the key contextual considerations for earnings quality revolve around the following questions:
- Is the Level of earnings quality an indicator of fundamental value?
- Does the Change in earnings quality provide earnings momentum indicators?
- Does the Nature of earnings quality may provide risk indicators?
- Is the Perception of earnings quality a possible share price indicator?
Each of these questions must then be considered along with an understanding of:
- Where it fits in the individual investing framework; and
- What else is relevant to that framework.