
Balance Sheets – Overview
There are men who can write poetry, and there are men who can read balance sheets
Balance Sheet Analysis
The Financial Frame is about understanding the three financial levers at the firms disposal:
- Profitability, as measured by Returns;
- The manipulation of profitability via Earnings Quality; and
- The Balance Sheet.
Balance Sheet analysis fits into this Framework in two ways:
- Firstly, the balance sheet is a measurement tool that captures the residual Accrual between cash flow and profit. This residual can be used as a lever to drive profitability, via capital expenditure, earnings manipulation or acquisitions. Analysing this residual is a core function of Returns and Earnings Quality analysis, which as we have seen are essentially opposite sides of the same coin.
- Secondly, the balance sheet can be used as a way to allocate risks and returns between different providers of capital. Whilst some of this allocation is measured via the P&L, it is primarily understood via the balance sheet. From a shareholders perspective, the ability to alter the respective allocations is a source of both potential value accretion (or dilution) and risk.
Balance Sheet – The Specific Questions
Like all tools, we need to place balance sheet analysis in context by linking it with the immediate and broader questions we are trying to solve. In addition to its use in understanding returns and earnings quality, this analysis can be used more specifically to help understand the Balance Sheet…
- As a source of realisable value? Are there assets (or liabilities) that offer the potential to increase (or detract from) the fundamental or perceived value of the company;
- As a source of optional value? Does the balance sheet provide the optionality to deploy capital in a way that will create real (high returning investment) or perceived (EPS accretive) value? Alternatively, does the balance sheet exist as a negative option that will require the company to release capital in a way that destroys real (low returning divestment) or perceived (EPS dilutive) value?
- As a source of earnings risk? Does the composition or structure of the balance sheet have the ability to positively or negatively impact earnings? Both in the short term via changes in costs, or the long term via changes in competitve positioning?
- As a source of liquidity risk? Does the tenor of liabilities impact the ability to pay debts as they fall due? Does this create the potential for real value impacts?
- As a source of solvency risk? Does the level of liabilities impact the residual value that exists in the company for shareholders?
Balance Sheet – Basics
In examining these specific questions, there are some basic features of the balance sheet to keep in mind:
- System Snapshot: The Financial Frame is one way to measure and understand the behaviour of the company System. The balance sheet, representing a snaphot of this system in time, poorly captures its dynamic aspects. It is not necessarily representative of the behaviour of the system over the period between snapshots, and it fails to to highlight the inter-relationships and feedback loops within the system.
- Asymmetric Errors: Like all accounting entries, balance sheet values are estimates. Just as we need to understand the statistical significance of earnings, we need to understand the possible errors and omissions in the reported balance sheet. In particular, we need to understand the asymmetry of these errors.
Liabilities
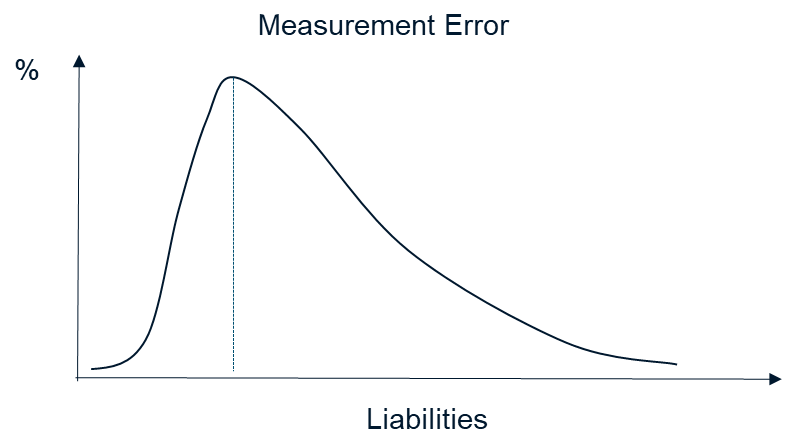
Most liabilities are generally fixed obligations. Only in vary rare circumstances will the amount of this liability decline (as opposed to being repaid). In contrast , there are many situations in which both individual and aggregate liabilities may increase. For example debts may increase due to penalty clauses for late payment, whilst the full amount of long term contracts may become recognised in the event of financial stress, even though not originally recorded on the balance sheet. In statistical terms, the distribution of errors for our liability estimates is positively skewed.
Assets
The general mechanism for recording assets is historic cost. Depending on the performance of the business, this estimate will likely either over or under value our assets. In statistical terms, our asset estimates will have a wide standard deviation.
The fact that the stock market generally trades at a premium to book value whilst delivering good long term returns suggest that in aggregate this standard deviation also has a positive skew. However, because this measure excludes all the assets that have gone to zero, in most individual cases we can assume a fairly significant left tail to our errors.

- Dynamic Errors: The combination of asymmetric measurement error and a dynamic system means asset and liabilitie values are potentially linked. For example , if the business is performing poorly, assets are probably worth less than book value. At a certain point, this could force divestment of assets below book value, whilst potentially increasing liabilities as financial stress grows. This is a potential negative feedback loop whereby increasing liabilities decreases asset values and decreassing asset values increases liabilities. This instability of such a situation increases the likelihood of measurement errors.
- Hierarchy of Book Values: Equity Analysts have been conditioned to represent the Balance Sheet as:
Equity = Assets – Liabilities.
However, such representation is misleading. Because different liabilities have differing priority when it comes to repayment, they have an effective first claim on certain assets.
Therefore, rather than writing:
E = A – L
= A1 + A2 + A3 – L1 – L2 – L3
… we need to rewrite this as
E = A3 + (A2 + (A1 – L1 – L2 – L3))
This means that Equity is only worth the residual assets. Thinking of Equity as owning a slice of deferred tax assets and other intangibles certaintly clarifies thinking around leverage and Price/Book Value valuation methods.

Balance Sheet – Conclusion
Balance Sheet analysis is both a component of our Returns and Earnings Quality analysis and a fundamental source of information in its own right. Like all of our tools it needs to be interpreted within the context of the specific questions we are asking and applied within the broader context of our overall Investment Framework.