For all their perceived failures in front of the Banking Royal Commission, ASIC have certainly been busy doing one thing over the last decade or so –writing Regulatory Guides. At last count these numbered 269 – representing, at a guess, 10-15k pages of regulatory gumpf.
RG 53, penned in July 2003, covers “The use of past performance in promotional material.” Sadly, this guide seems indicative of ASIC – it is neither well worded nor well enforced.
The Use of Past Performance
Almost all fund managers use two forms of past performance analysis in their client marketing. A chart showing the value of a dollar amount invested over time and a table showing performance for various time periods.

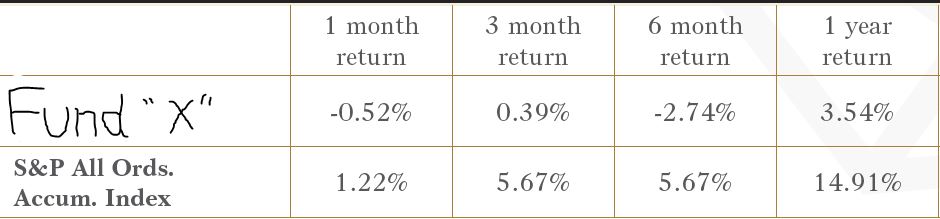
According to RG 53, ASIC allows the use of such material provided that it is not misleading. However, a quick scan through fund manager reports highlights at least 4 areas that seem to fail this test.
They exclude Tax
The vast majority of past performance charts and tables are presented on a pre-tax basis. This is misleading in presenting both the absolute and relative returns of a fund.
In considering absolute returns, RG 53 notes that “a promotion can be misleading if it uses a methodology … that is inconsistent with … the actual performance of the product or service.” For almost all Australian investors, in almost all managed funds, the actual performance of the fund is the after tax return that it delivers. Despite this, almost all past performance analysis is presented on a pre-tax basis.
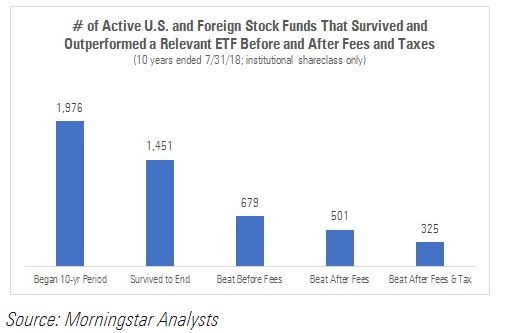
The argument extends to relative returns. Evidence from Morningstar suggests that the relative returns of active versus passive funds are worse on an after-tax basis. Whereas one in four active funds beat a relevant ETF after fees, only one in 6 managed to beat the relevant ETF after fees and after tax.
They show time weighted returns, rather than dollar weighted.
Many funds start small, succeed and then raise lots of money. Unfortunately, the ability to do with a lot what was originally done with a little is often lacking. Including initial large gains on small funds and then reporting returns “since inception” does not represent the experience of the average investor in these funds.
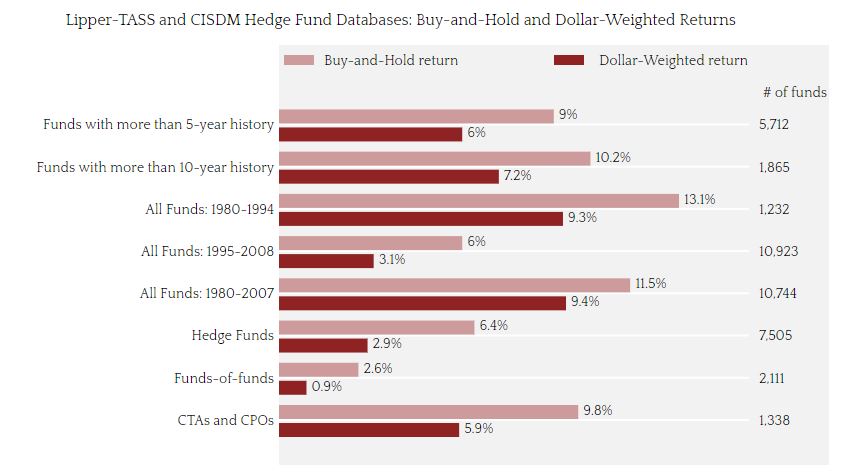
Industry evidence suggests that dollar weighted returns (ie. the average experience of investors) are considerably lower than time weighted returns generally reported by fund managers.
They exclude performance of other funds that have underperformed.
Open lots of funds. Some do well, some do poorly. Promote those that do well. Shut those that don’t. Reporting on only the winners is classic survivorship bias.
RG 53 specifically highlights this behaviour as being misleading, but it is arguable whether this interpretation is ever enforced.
Inconsistent treatment of fees.
There does not appear to be a firm standard in RG 53 for how fees should be reported. Whilst RG 53 says “The use of gross returns may be misleading”, this practice is only “discouraged” not outlawed. Returns should be reported “net of fees to the greatest extent practicable”.
Somewhat strangely, RG 53 then specifically gives managers the ability to report returns excluding certain fees, provided these undeducted fees are separately disclosed. E.g. “These returns are after deduction of ongoing fees. A 4% fee also applies to the initial investment.”
Conclusion
I’m no coding expert, but surely it can’t be that hard for ASIC to create a standardised template/widget for licenced fund managers to include on their website. This would show returns after all fees, both as a time series and for individual periods. It would also give investors the ability to input their preferred:
- Tax rate.
- Time period; and
- Choice of dollar weighted or time weighted returns.
More importantly, rather than simply drafting such guidelines, they might actually enforce them? Just a thought.