We have previously discussed the use of EV/Sales as a valuation tool. In short, EV/Sales is useful where sales provide better information about future cash flows than current earnings.
In this post we expand upon using EV/Sales in the case of cyclical stocks, starting with teh following examples: contractor Cimic (CIM); supermarket retailer Woolworths (WOW); and scrap metal recycler, Simsgroup (SGM). In all three cases there are two points to note:
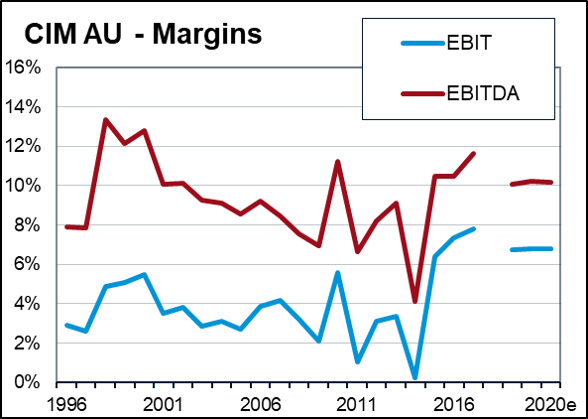
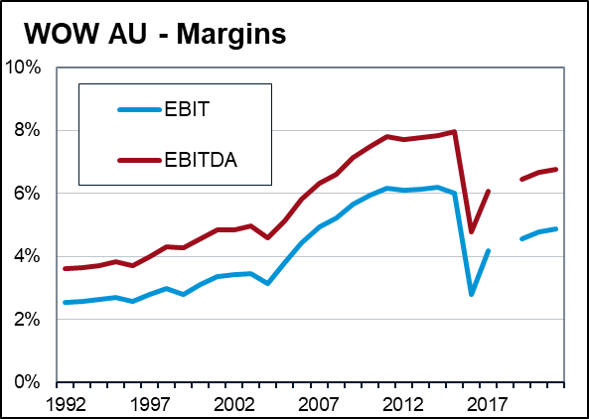
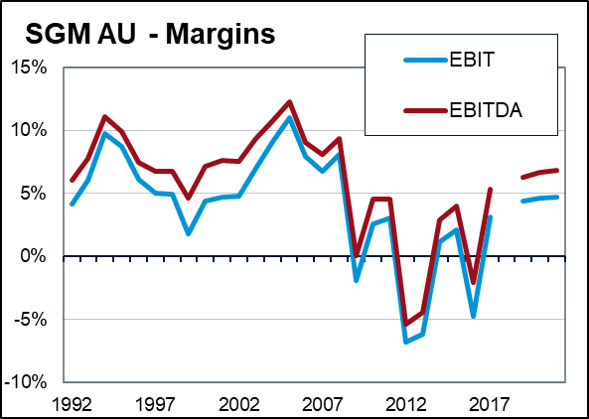
- Firstly, margins in these stocks have been classically cyclical. The causes of this are a mix of both internal and external factors, but the result is a history of margins that in each case have varied by more than 2x over this time frame; and
- Despite this history of volatility, market estimates are generally an extrapolation of recent trends. Therefore, to the extent that such volatility arises, earnings forecasts and therefore earnings based valuation multiples will be wrong.
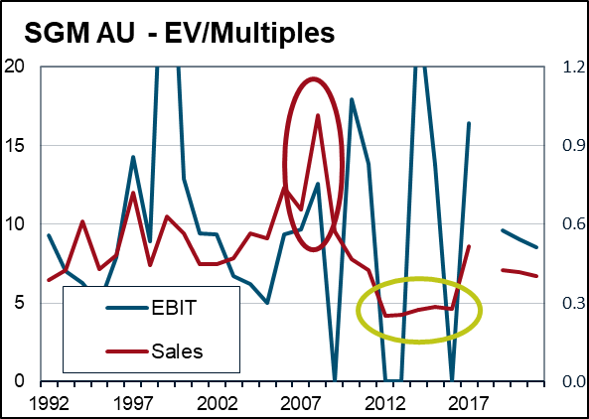
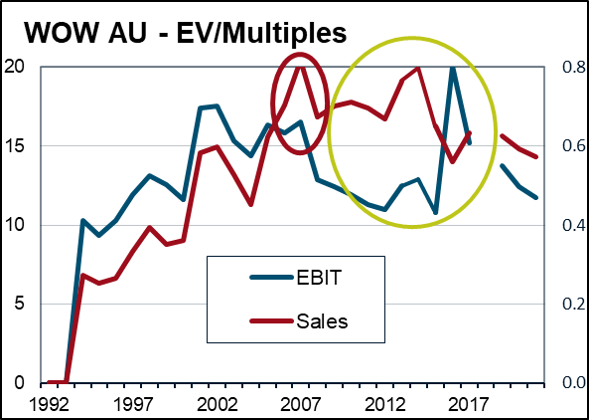
Because of the tendency of the market to ignore this historical margin volatility and to price on forward earnings, using EV/Sales multiples will provide an additional piece of information.
At times this information will confirm the earnings signal (Red circles). Our confidence in these valuation signals should be higher than normal.
At other times the two measures will give different views (Green circles). Here we should exercise some caution and try and decide which signal is correct.

Finding a normalised margin
To work out which valuation signal is correct, we need to make an assessment of the sustainable earnings of the business. Recall that a key attribute of EV/Sales over EV/EBIT is that it shortcuts this process this via an implicit normalisation of margins:
EV/Sales = EV/EBIT * EBIT/Sales
Which can then be used to generate a valuation as follows:
Target EV/Sales Multiple = Target multiple of EBIT * Sustainable Margin
To use EV/Sales as a valuation tool for cyclical stocks, we therefore need to make an assessment of “normalised” margins. This may be either an absolute level, or relative to peers. Whilst there is never a definitive answer to this question, through a combination of both quantitative and qualitative analysis we can make a reasonable probabilistic assessment.
Quantitative Assessment
We can derive some base rate data by assessing current margins:
- Relative to the company’s history (as per charts above); and
- Relative to peer companies and competitors.
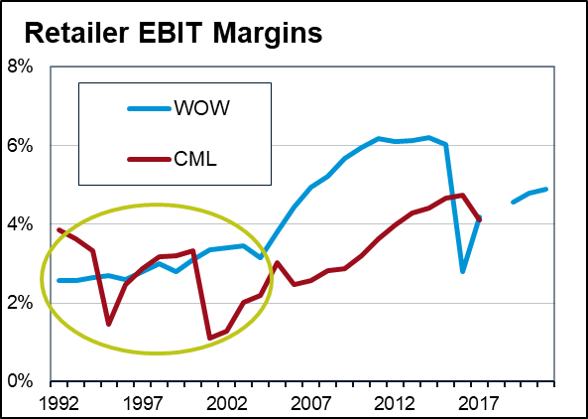
In the case of WOW, there is a long track record (preceeding this chart) of industry margins around 3%. This base rate questions the sustainability of WOW margins at the higher level of 6%.
Of course this assessment needs to reflect:
- Any material differences in business mix over time or between companies. For example, SGM, BSL and ARI are all in the steel industry, but have very different exposures between trading and distribution and vertically integrated manufacturing. We would therefore expect the absolute level of their margins to be different; and
- Any differences in accounting treatments. Is one company recording gross revenue on transactions versus the net margins of a broker? In the case of retailers, an appropriate normalisation would be a consistent treatment of property ownership/rental expenses. i.e. maybe compare EBIT margins pre rent expenses.

Qualitative Assessment
The next step is to compliment the quantitative picture with a qualitative operational assessment of the company and its industry to understand the extent to which “normalisation” forces are at work. We can leave the detail for another day, but some basic points regarding our examples:
- Cimic (CIM): Contracting is a classically cyclical industry, with both external and internal drivers. In this case the external macro was the huge resources boom in Australia in the mid 00’s, leading to dramatic growth in sector profitability. The downturn of this external cycle was exacerbated by a series of poor internal decisions and unprofitable contracts. Nevertheless, the industry had a long history of low single digit margins which provided some base rate confidence about potential longer term profitability.
- Woolworths (WOW). The long history of ~3% margins in the industry provided a base rate that the step up in margins to 6% might be unsustainable. The drivers of this (higher WOW GP after many years of continuing to reinvest in price to grow market share) also didn’t suggest sustainability. Not surprisingly, these higher levels of profit provided a target for both their main competitor Coles and new international entrants. Margins returned to their longer term trend.
- Sims Group (SGM). Another classically cyclical industry, the collapse in margins post the GFC was greater than earlier cycles due to the build up of shredding capacity and a structural decline in scrap generation. The cycle in this case was extended, but appears to be normalising.
Getting the sales base right
Most of our analysis above has focussed on trying to understand the normalised margin of the business. But of course we can’t forget the sales base. On average sales are more persistent than earnings, but this doesn’t mean they are always persistent. Three situations need monitoring:
Cyclical Sales
In some cases, sales are so highly cyclical with earnings, that an EV/Sales multiple will not be particularly accurate. This doesn’t mean it can’t still be useful for identifying extremes of valuation, but it won’t be a particularly good measure for trying to derive a mid cycle target price. For example, drilling services company Boart Longyear (BLY) has seen sales double and more than halve. The EV/Sales multiple in this case has not provided great signals.

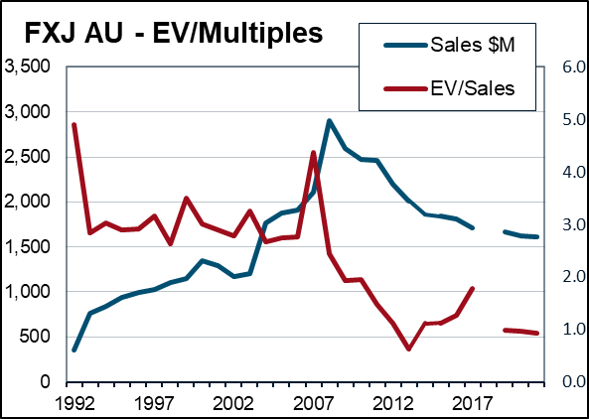
Structural Decline
The most common value trap is buying a previously cyclical business that is now in structural decline. In this situation, neither cheap earnings not cheap sales multiples will suffice if the cause of margin pressure is a structural decline in sales.
Restructuring
Part of the rationale for buying cheap EV/Sales stocks is that there will be a turnaround in profitability that restores margins to a normal level. Of course, sometimes this can occur simply by selling or closing the underperforming sales. Margins in this case might improve, however this is on such a reduced sales base that earnings don’t.

Conclusion
Like all valuation models, EV/Sales involves a lot of subjectivity. The factors behind a normal margin are complex – the simple process above is designed to help improve the probabilistic assessment of outcomes. Similarly, whilst sales are often more persistent than earnings, sales might by so unstable as to make EV/Sales no better than earnings multiples. In addition, use of the tool requires understanding the various pitfalls in calculating EV and the potential volatility involved in applying the multiple with leveraged companies.
Nevertheless, EV/Sales is a useful tool that can often provide additional information. It may help reinforce a value story, or it may contradict it. In both cases this is useful. As a bare minimum it can dial up or down our confidence in an investment thesis.
Classically cyclical companies, where margins exhibit lots of volatility around some normalised level, are a good example of where the tool can be most useful.