The share market is driven by stories and during reporting season, the most popular stories are those about earnings. Whilst there are plenty of possible narratives attached to each earnings release, in this article the aspect I want to focus on is – how believable are the reported earnings?
In a mathematical sense, the believability of earnings would be captured using a probabilistic frame to determine their statistical significance. In my all time favourite article on this subject, Bloomberg columnist Matt Levine describes this idea in relation to Bank of America’s quarterly earnings:
“A bank’s earnings are a quantum event; they are entirely probabilistic, and the answer you get depends on who’s doing the observing. You make some guesses with some degree of statistical likelihood, and then you apply one of a half-dozen accounting regimes to the guesses, and you get a number, and then you’re like, ooh, look at this number, it’s so numeric.
But it’s not a thing in the world. It’s just the output of applying your rules to your inputs. But your inputs are fictions, and your rules are fictions, so it’s very silly indeed to treat your output as a fact.”
This lovely quote neatly captures the two ideas behind the statistical significance of earnings – how well do we know the true economics of what the business is doing and how good a job do we do of representing this with a reported accounting number? (In the Equity Toolkit, we analyse these ideas under our Financial Frame as Earnings Quality.) In this article I hope to use today’s earnings release from Genworth Australia ($GMA.AU) to highlight some of these ideas. As an insurer of bank earnings, Genworth’s earnings move beyond basic quantum mechanics into the realm of string theory.
Genworth Overview
Genworth provides lenders mortgage insurance. In return for a premium paid by a mortgagee, it agrees to reimburse the bank if the mortgagee cannot make good on their loan. It goes without saying that this is a more risky proposition than mortgage lending itself. Genworth receive on average 1.65% of the mortgage as a premium, paid upfront. In contrast, the banks net interest margin is >2% and they receive that for every year of the mortgage. In addition, we can be almost certain that Genworth get the priviledge of doing this for only the riskier portion of the banks new mortgages.
In working out how much profit they make from this process, Genworth must make three large estimates:
- As the premium is paid upfront but applies for the life of the loan, how much of the premium should be recognised as income (net earned premium) in each accounting period?
- What percentage of the premium should be set aside to cover losses where mortgagees default on their loan?
- What is the income generated on the insurance float?
For any company, one of these estimates on its own would be enough to make us cautious on the reliability of the end output. In the case of Genworth, the reliability is further clouded by the nature of the underlying insurance contract and their balance sheet structure. To understand why this is the case, let’s consider the process of estimating mortgage losses – by far the most important of the above estimates.
The Problem with Housing Statistics
All insurance contracts are written using actuarial assesment of probabilities. There is naturally a risk in this process, but in many cases, the probability distribution of outcomes is reasonably well understood. This is not the case with housing loans. Compare the distributions of losses on Australian Home Building Insurance with an international selection of those on housing loans:


If you are trying to work out what losses will be on building insurance, then you have to make some estimates, because the number varies. But this variance is within normal parameters. If you estimate an average loss, your estimate is not perfect, but workable. Whats more, because you have some idea of the variance of losses, you have some idea of how believable your estimate is – in statistical terms you could work out a confidence interval. Losses on housing lending on the other hand, provide neither the ability to estimate an average nor enough data to estimate variance.
The mathematics behind all this is way too complicated for me (if you want a better description of this you can start here..), but the basic problem is that each mortgage loan is not independent, but is part of a dynamic system that fluctuates not around some equilibrium, but is driven by powerful feedback loops. Very simply, the willingness to lend increases the capacity of borrowers to pay more, which bids up asset prices, which increases consumption and employment, which reduces defaults, which increases the willingness to lend .. and so on. The result is that the housing market is either in a good phase where this feedback is working positively – or a bad phase – feedback is working negatively. Attempting to average these two phases will produce an “average” estimate of losses that is always wrong – too high in the good times and too low in the bad. Given the long duration of the cycles, this means wrong answers most of the time. It also means a lack of meaningful data to work out what true averages are and the variance and skewness of the sample.
So for the most important estimate in our earnings process, the default rate, we don’t know (i) the average, (ii) the variance or (iii) the skewness of our estimate. In short, we don’t know the answer and we don’t know by how much we don’t know it.
The Problem with Mortgage Insurers
The fact that we don’t know, with precision, an element in our earnings estimate, is not unique to Genworth, although the magnitude of our error is certaintly towards the high end of the spectrum. What starts to make the Genworth earnings estimate really interesting (or unbelievable if you prefer), is the leverage factor that we need to apply to our estimate.
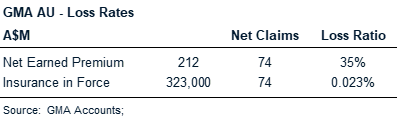
At first glance, it appears as if the estimate of the default rate is quite large relative to the business. Genworth quote a loss ratio that has varied from 18 – 70% since listing, which is not only volatile, but seems like it is quite chunky. As Matt Levine would say – it seems quite “numeric”. But quoting the loss ratio this way is slightly misleading – its the ratio of the estimated increased losses incurred on a stock value (the total value of risk insured) divided by a flow variable (the estimated income) – which is a strange combination of things to compare.
Instead, if we look at this loss ratio relative to the underlying stock that it represents, we see how tiny this estimate is. For the six months just past, the net claims expense represents under 1/4 of 1% of the total amount of mortgages insured (or slightly under 1/2 of 1% on a full year basis). So if we are out by just some small fraction of a % in our estimate of what losses will be, then the absolute dollar of losses might vary significantly from our estimate.
Indeed this is what we see historically, small adjustments in loss estimates leading to big swings in the earnings loss rate. It is simply the effect of leverage and as far as it goes is reasonably well understood by the market.
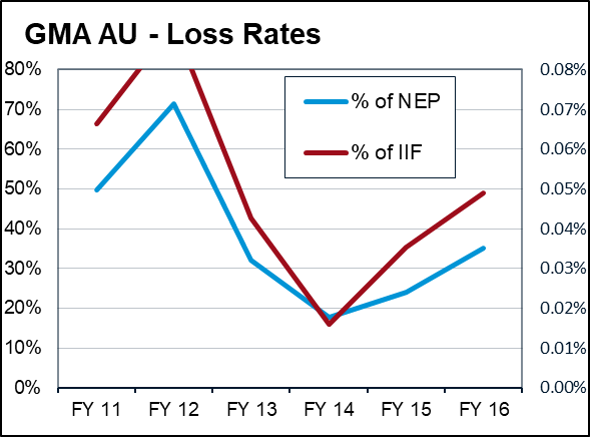
But the real uncertainty arises when we appreciate what the small number means. It means we are trying to estimate something that happens in the extreme (the tail in the statistical vernacular). Again I defer to Nassim Taleb for a more accurate description of what this means mathematically, but in short it is very difficult to get proper estimates in the tail, so we have very little idea about the accuracy of this number. Is it 0.1% as in FY 12, or 0.02% as in FY 14? Or is it possibly 1%, or even higher? Certainly possibly given Genworth US averaged almost 1% losses on insurance in force for the period Fy 08-10.
The effect of leverage on these potentially small changes in loss estimates is to wipe out earnings completely. Given the ridiculously narrow capital bases of the mortgage insurers – for Genworth there is roughly $2bn of capital supporting $320bn of insurance – these too are highly exposed.
So what to believe?
In his summation of Bank of America’s earnings, Matt Levine noted “It is not possible for a human to know whether [they] made money or lost money last quarter”. We might say the same about Genworth. Over time, as the mortgage book runs off, we will be able to look back and say with some certainty what earnings were in this year. But at this point, looking forward, we can only make do with an estimate and a very rough one at that. The earnings number itself is certainly not something we should place a high degree of confidence in.
Does this mean that we should ignore today’s earnings release? Not at all. It just means that we should be asking different questions about the story than simply following the earnings narrative.
Here is a list of some questions that might be relevant:
- How large do we think the uncertainty is with respect to the earnings estimate? It would be nice if all earnings estimates came with confidence intervals, but not only is this unlikely to happen, but in the case of Genworth, we don’t know what we don’t know. Nevertheless, at a minimum we should attempt to put some qualitative assessments around our confidence in this number.
- In which direction do we think the bias and skewness of the estimate lies? As noted above, a tendency to use average default rates will generally make the estimates too conservative in good times and not conservative enough in bad. But in aggregate? As Taleb notes with flight times, there is a much greater skew on the side of those arriving late than those arriving early.
- Do we think the estimate of current earnings is more or less aggresive than the last time the company made an estimate? Has the company changed their accounting assumptions? Have the accounting rules changed? Has the company kept their assumptions the same in the face of changing underlying conditions?
- Do we think the market under or over estimates the accuracy of the earnings estimates? The core of Sloan’s seminal paper on accruals was that the market was not great at valuing earnings that were less persistent. Similarly, it would seem a fair bet to assume that investors will over estimate the accuracy of highly uncertain earnings.
- Finally, how do we think investors will react to the earnings story as presented? This will determine the near term flow – you can go with that or against it as you wish. The important message with this question is not to focus on the earnings themselves as something real, but instead to focus on the real investor reactions to those less real earnings. For example, will investors be enticed by a cheap headline PER?
As always, these ideas are but one frame for the analysis. Whether they make Genworth a good or a bad investment is not for this website. However, Genworth does provide a great example of some of the things that should be front of mind as the earnings narratives come thick and fast in the next few weeks.