A Top Down Apprach to Understanding SaaS Value Creation
Software as a Service (SaaS) stocks are all the rage at present. The 53 companies in the Bessamer Venture Partners (BVP) Cloud Index have a median market cap of US$2.4bn. However, only 17 are profitable at the EBITDA line and these trade on a median EV/EBITDA multiple of >50. On traditional metrics this screams Bubble. Maybe, maybe not.
In this series of posts we will examine the Value Stories that are told by investors about how SaaS companies create value. Like all growth companies, these stories centre around the ability of the company to create value by investing capital at positive rates of return. However, because high growth software firms often tend to have low or negative levels of profitability, analysing value creation through accounting earnings is usually ineffective. Instead, the shorthand approach of most investors is to value such stocks based on both the level and rate of growth of sales. Is this reasonable?
The Importance of Sales
Whilst its important to be sceptical of valuation metrics that don’t relate to free cash flow, for software companies there are some good reasons why sales and sales growth can be linked to this ultimate objective:
- Software operations generally involve high fixed costs of software development and platform administration offset by high gross margins. Therefore sales growth is a proxy for incremental cash flow growth; and
- The costs of growth, R&D and Customer Acquisition Costs, are usually expensed as incurred. This depresses short term accounting profits and measurement of return on investment, even where the true return on investment is very favourable.
With this is mind, how do we understand the twin pillars of opportunity to deploy capital and the return the company will generate on that capital.
Step 1 – The Ability to Deploy Growth Capital
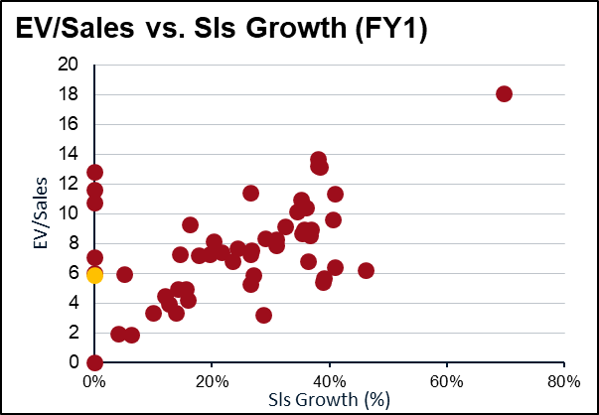
The general standard for measuring the ability of a SaaS company to deploy capital is sales growth. Current sales growth is taken as an indicator of future sales potential. Faster growth attracts higher valuations.
The accompanying chart derived from Bloomberg, shows the EV/Sales valuations of the 50 odd companies in the BVP Cloud Index relative to their forecast sales growth.¹ The correlation, whilst not perfect, is solid. The market in general believes that current sales growth is representative of future value creation ability.
Whilst aligning valuation and rates of growth seems simplistic, it has surprising validity. In a major study of listed software companies, McKinsey found that growth rates were a key determinant of both long term sucess and shareholder returns. Their key findings were:
- High growth companies had shareholder returns 5x those of medium growth companies;
- “Supergrowers” – companies with growth rates >60% at $100m of revenue – were 8x more likely to become a $1bn revenue companie than those with growth rates of 20%; and
- For companies with revenue <$4bn, growth rates were twice as important for market cap. gains as margin improvements.
Whilst these findings demonstrate the importance of growth, they are aggregate base rates not absolute truths. Whilst 85% of companies that reached $1bn in revenue started life in the highest growth categories, 15% did not. Whilst the majority of companies in the fastest growth rates slipped a notch after reaching $100m in revenues, around one third of these companies are able to climb back to faster rates of growth.
The top down correlation between growth rates and valuation is good, but not perfect. Whilst it provides a good indicator of ability to deploy capital, we also need to understand the return on that capital.
Step 2 – The Return on Invested Capital
The top down return on growth capital for SaaS companies can be measured in a couple of different ways.
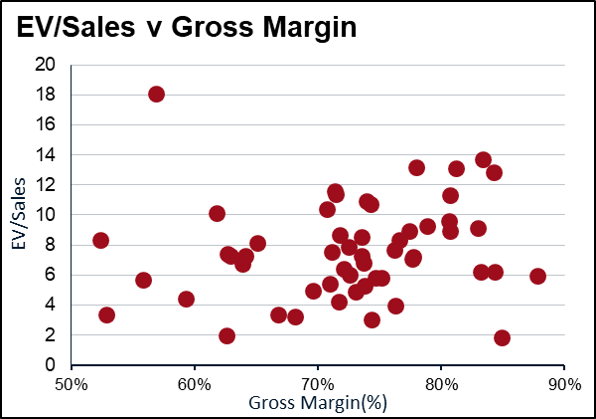
The first consideration is gross margin. This is high for most software businesses, but higher for some than others. Pure SaaS offerings should have GM’s in the 80% range, but this might be lower for enterprise SaaS offerings with a high level of implementation and customisation.
There is again a correlation between GM’s and valuation. This makes sense on the general assumption that higher gross margins should result in higher returns on investment.²
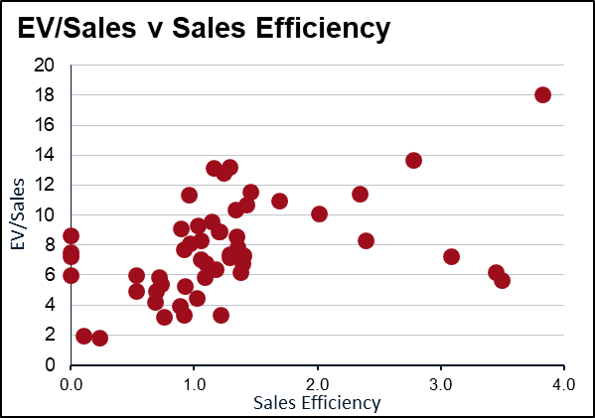
A second consideration is the return on marketing investment, which can be measured by Sales Efficiency – how much in incremental sales growth is generated by each sales dollar? Companies that can generate more sales growth for every dollar of marketing should attract a better rating. Once again there is a correlation, although far from perfect.
A final top down measure of returns might be employee efficiency – how many dollars of ARR is generated per employee.
In addition to these top down approaches, there are also many bottom up ways of measuring return on investment. We will examine these in a separate post.
Conclusion – Top Down Value Creation
Whatever the stock, value creation is a funciton of the ability to deploy capital multiplied by the return on that capital. For SaaS companies the top down short cuts for determining these questions are Sales Growth and some sort of top down return measure – gross margin/sales efficiency etc.
SaaS investors have come up with a neat way of combining these two questions known as the rule of 40%. Broadly stated this rule is that the rate of growth (a proxy for total ability to deploy capital) plus the free cash flow margin (a proxy for return on investment) should exceed 40%.
This simple rule recognises the trade off between growth and profitability and measures the efficiency with which companies make this trade off.
Not surprisingly, given it captures (albeit imperfectly) both elements of value creation – it has a reasonably consistent correlation with value.
