In a recent AFR article, Alex Waislitz was quoted in relation to his shareholding in Getswift,
“you may have a framework of revenue over the next 12-18 months of $20-$30 million. Some tech companies are trading on 20-30 times revenue. If that promised revenue does come through for GetSwift then you could see them being valued again at $400-$800 million.”
This quote offers a good opportunity to put our recent SaaS Valuation and analysis framework (Part I, Part II, Part III) into practice. It prompts a number of questions:
Is Sales a Legitimate SaaS Valuation Metric?
In Part I of our SaaSy stories, we noted that software stocks were no different to other stocks in the way they created value – i.e. by deploying capital at high rates of return. By virtue of their high gross margins and generally conservative accounting, the best way to understand this process was via the sales line. As a result, both private and public markets tend to use EV/Sales as a shorthand valuation tool for the sector.
Is 20 – 30 x Sales a legitimate level for this measure?
Like all valuation tools, the absolute level of EV/Sales that reflects “fair value” is difficult to pin down. Certainly the multiples deemed appropriate by both public and private markets fluctuate over time.
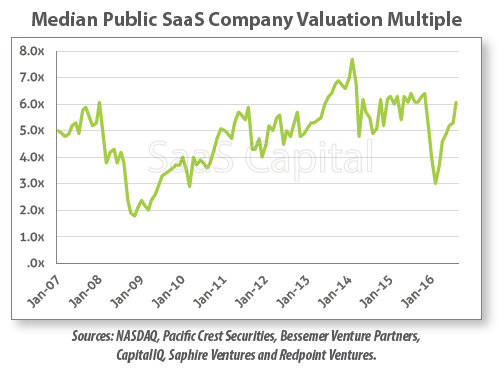
For example, over the last decade the BVP Index of SaaS stocks has traded between 2 and 8x revenue. The current median multiples of 7.4 suggest that listed SaaS stocks are at the top end of their normal range.
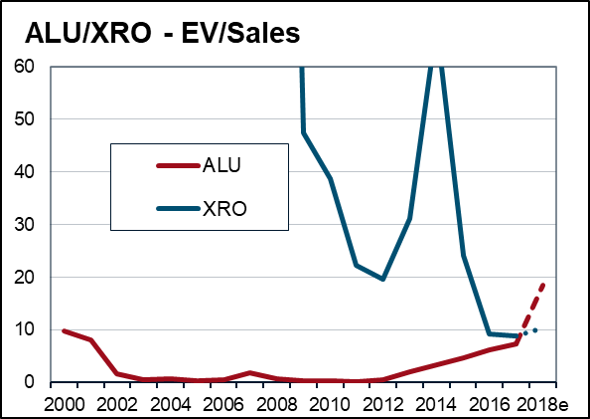
Secondly, as discussed in our article on the Gartner Hype curve, stocks tend to have their own individual valuation cycle.
For example, consider the extreme high and low cycles experienced by Xero ($XRO) and Altium ($ALU).
We can conclude by noting that within a selection of 100 or so Australian software stocks, there are certainly some trading at 20-30 x revenues. But even allowing for an absolute level of valuations in this sector that is currently high, stocks on these lofty multiples are more the outlier than the norm.

What stocks deserve to trade at 20-30x revenue?
It is often said that more money has been lost in the search for yield than at the point of a gun. If true, a close second might be the losses incurred buying something because it was “cheaper than” something else. So the relative comments below all come with the caveat that absolute starting prices appear high.
To understand which stocks should command top end multiples, we obviously need some examples.
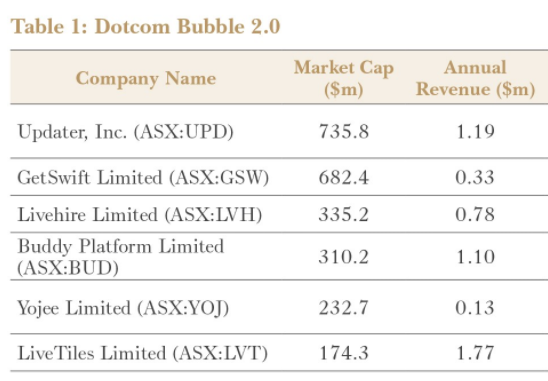
For the sake of conversation i’ve taken a sample from the list of stocks described by Steve Johnson of Forager Funds in his December newsletter as represening Dotcom Bubble 2.0.
(Note market caps as at time of Forager Publishing – not current).
Growth Rates
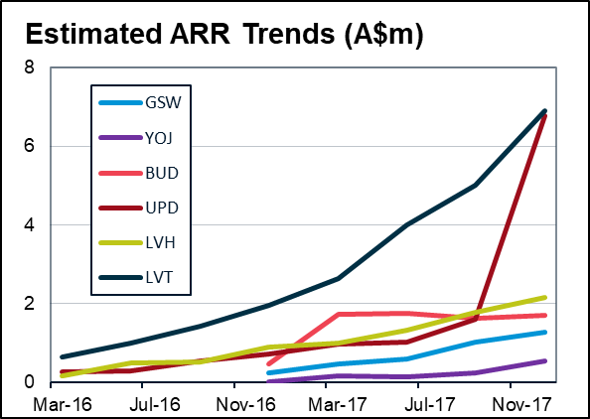
Step 1 as we highlighted in SaaSy stories Pt I is to look at revenue/ARR growth rates as a reasonable first proxy for future sales potential of the business.
How do our collection of high value stocks compare?
From a top down perspective, growth rates for all of them look high. Obviously this is a bare minimum to justify current extreme valuations.
Some further context.
- Company disclosure prevents an assessment of true ARR. We have used proxy’s. Coupled with the small absolute level of revenue involved means the statistical significance of all numbers is low.
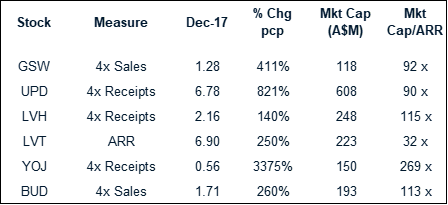
- As noted in SaaSy stories Pt II, growth rates need to be contextualised by benchmarking against companies at a similar stage of development. This benchmarking shows that median and top quartile growth rates are ~200% and 400% respectively for ARR <$1m, dropping to 100%/200% as ARR grows to $2.5m. Against these benchmarks the above growth rates still look very good, with the possible exception of $LVH.
Return on Growth
As highlighted in SaaSy stories Pt I the second step is to look at the return on growth. Some top down proxy’s for this are:
- Gross margin;
- ARR/Employee; and;
- Sales efficiency.
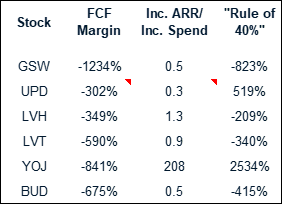
Sadly the disclosure and small numbers involved for our sample make calculation of some of these metrics difficult. However, all are heavily cash negative and with the exception of $LVH, for every $1 of increased expenditure, revenue is rising by <$1.¹
As noted, the numbers involved for all companies are small and so the statistical significance of many of these metrics needs to be taken with a degree of caution. Whilst this means we can’t rule out that these companies are creating a lot of value, the general top down analysis doesn’t highlight this as a starting conclusion. In summary, the top down analysis doesn’t categorically justify these stocks trading at >30x sales.
Conclusion of Top Down Analysis
The above is a very preliminary top down analysis as we advocated in SaaSy Stories Pt I. Its a starting point only and needs to be complimented by bottom up analysis as advocated in SaaSy Stories Pt II. Nevertheless, some preliminary company specific observations:
- Getswift ($GSW) – No need to add anything further in relation to this post recent newspaper articles and ASX releases. The quality of reported sales appears low and coupled with reported churn issues, there is not yet compelling evidence of strong future top line growth at attractive rates of return.
- Updater ($UPD) – On face value top down metrics look good, expecially given the parabolic revenue growth (historic and forecast). This is being delivered with relatively modest cash burn (relative to peers). However, the composition of this revenue growth is the key for further analysis. Bottom up analysis of this issue…. COMING SOON.
- LVH ($LVH) – Livehire appears to have the best return on investment amongst our small sample. However, revenue growth rates appear modest for a company at this stage in development that is still heavily loss making. Bottom up analysis of this issue … COMING SOON.
- Livetiles ($LVT) – Livetiles is the reverse of $LVH. Revenue growth is exceptional, but the cost of revenue acquisition appears high. In addition, recent revenue growth announcements have raised some questions. Bottom up analysis of this issue… COMING SOON.
- Yojee ($YOJ) – With cash receipts of just $139k in the past quarter, the numbers for Yojee are currently too small to do any meaningful analysis.
- Buddy ($BUD) – Buddy revenue growth has effectively flatlined over the last 12 months, reflecting what seems to be a pivot from the Buddy Cloud to the Buddy Ohm. As we noted in SaaSy stories Pt II – pivots are generally bad for short term investors. In this case Buddy Ohm revenue is not expected until the June quarter and the gross margins on Ohm revenue will likely be lower than traditional SaaS.
Disclosure: I direct readers to the general disclosure regarding this website. The above is not financial advice and I may trade in any of the above securities at any time going forward. In relation to the specific securities discussed in this post, I have both bought and sold shares in $LVT in the last 12 months, but no longer hold any position.