In part II of our SaaSy Stories, we touched on the importance of SaaS Churn in understanding business performance and valuation. In this post we discuss Churn in more detail.
The Importance of Churn
Getting customers is one thing, keeping them another. Churn is the metric that defines this relationship and is a critical indicator of both value drivers – the ability to deploy capital (Grow sales) and the return on that capital (Customer payback).
Churn and Growth
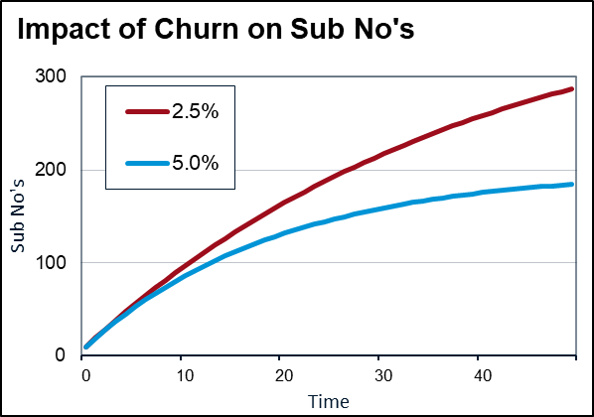
Churn has a major impact on the growth potential of a business. As churn increases, companies must work harder to replace cancelled subscribers. Eventually growth stops.
The chart opposite highlights the impact of churn on the maximum subscriber base of the company for a given level of gross adds. Simplistically, the maximum number of subscribers is equal to Gross Adds/Churn. Note the important feature that in the early stages of growth, it is hard to distinguish the trajectories of the two businesses. It is not until businesses start to mature that the impacts of churn on valuation begin to be felt.
Churn and Return
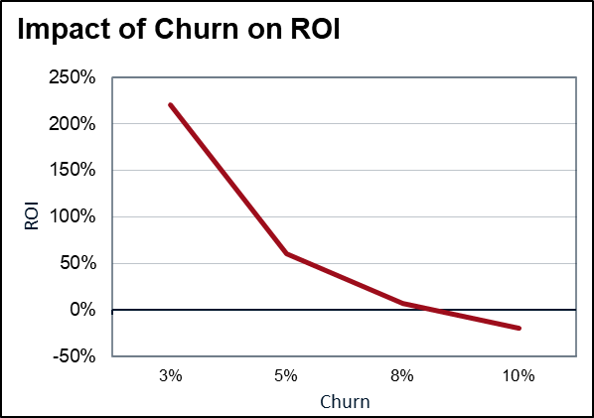
The other way or viewing the impact of churn is on the return on investment for customer acquisition. As customer lifetime decreases (churn increases) there is an exponential decline in the return on investment for customer acquisition costs.
Note that this is not captured in customer payback – which will be the same whether churn is high or low. This is why its important to understand both payback, a measure of the risk of spending on customer acquisition and ROI, which highlights the true (expected) returns from this spend.
Measuring Churn
In a mechanical sense, the measurement of churn is easy. Its the percentage of customers that stop being customers over the period of measurement. If you start with 100 and only 95 of those are left at the end of the period, churn is 5%. However, some points to note:
- Churn is usually quoted monthly. The actual period doesn’t matter, so long as when calculating LTV, ROI etc, consistent periods are used for all variables.
- Churn can be reported as its inverse, called retention. Instead of churn of 5%, retention is 95%.
- Churn can be measured both at the customer level (often called Logo Churn) or at a revenue level. Revenue churn measures the amount of ARR from the start of the period that remains at the end. Thus it is possible to have high Logo churn with negative revenue churn. The revenue lost from churning customers is more than offset by the increased ARPU of retained customers.
- Churn is not necessarily linear over customer life cycles. Churn may be high to start with in a given cohort, but decrease as customer become attached to products, then increase again as new competitor products become available. Because of this non-linearity, aggregate churn numbers might not necessarily give a good indication of average customer lives and hence ROI calculations.
Analysing Churn
Cohort Analysis
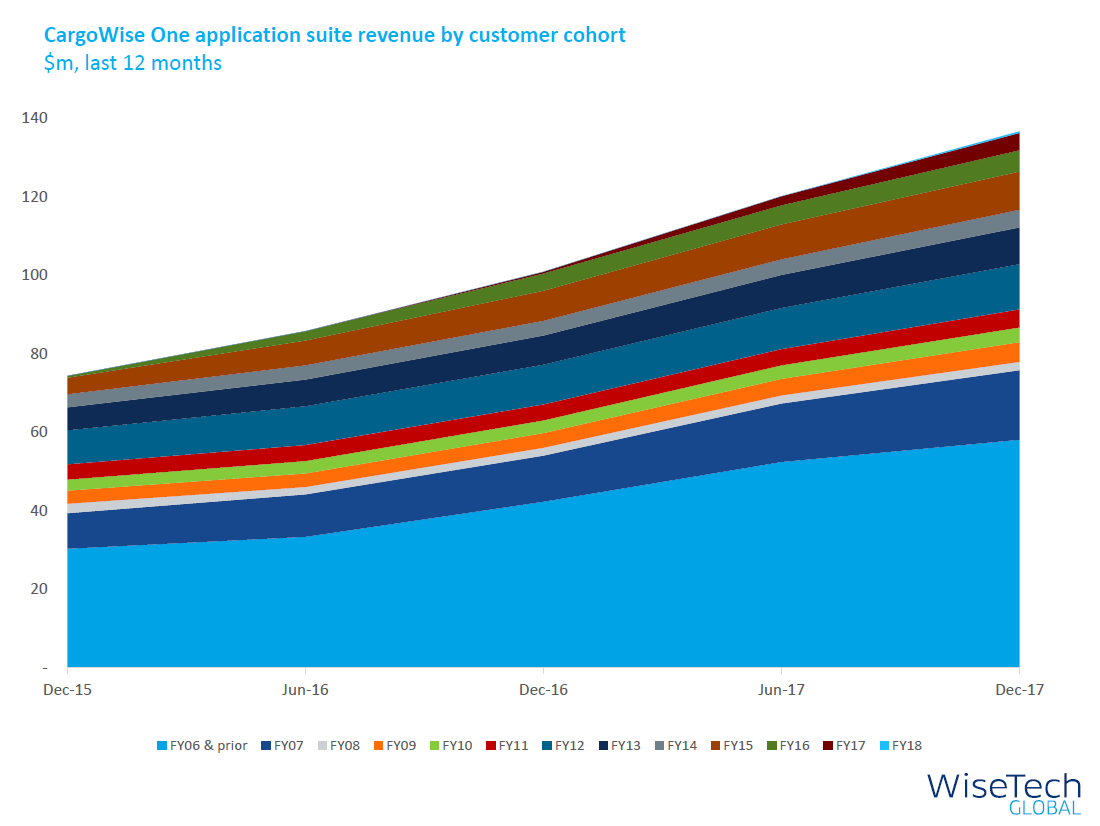
Because of the measurement issues noted above, a favourite way of analysing churn is via cohort analysis. This shows either customers numbers (or ARR) based on when the customer was acquired (the cohort). By looking at the performance of cohorts over time, it is easy to distinguish timing and mix issues on the reporting of aggregate level churn.
In interpreting these charts, rising revenue in a cohort indicates negative churn (a good thing) and falling revenue represents positive churn (a bad thing). The steeper the slope the higher the churn.
Quick Ratio
An alternative way to understand churn is via the Quick Ratio:
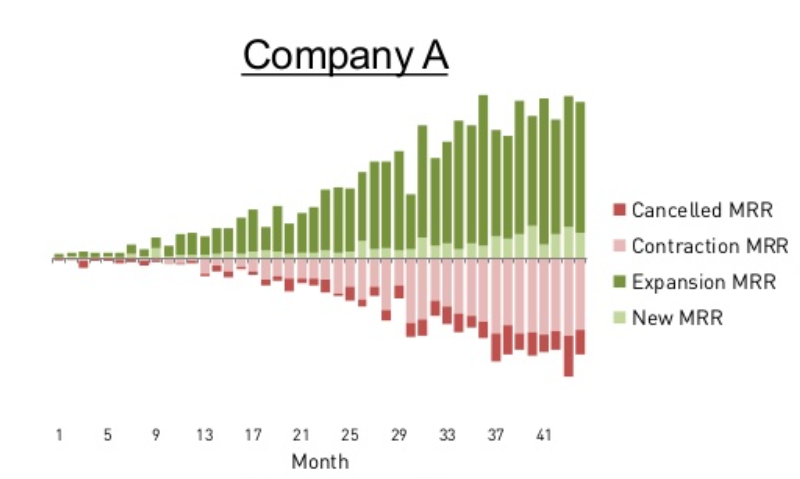
Quick Ratio = (New MRR + Expansion MRR) / (Churned MRR + Contraction MRR)
This measure balances both growth and churn, but distinguishes between growth with low churn (high Quick Ratio) which will be more sustainable and cost effective than growth with high churn (low Quick Ratio). A quick ratio of 4 is often quoted as being a benchmark for good SaaS performance, but it is important to note that as a company matures, its quick ratio will naturally trend downwards.
For callibration, the chart opposite describes a company with a Quick Ratio of 1.6.
Benchmark Analysis
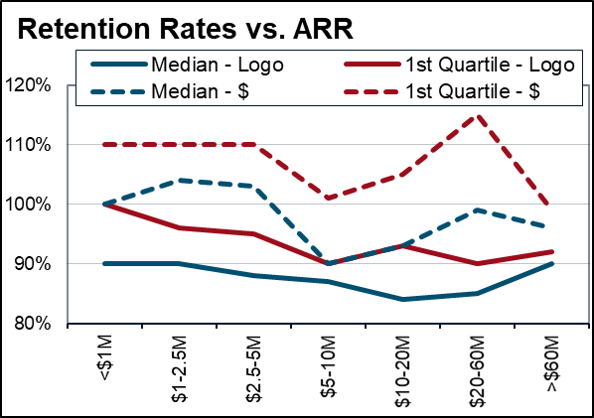
Much like ARR growth rates, churn rates can be benchmarked between companies. Top quartile companies will have retention rates >90% (churn <1% month) and revenue retention >100% (i.e. negative revenue churn).
As noted an alternative benchmark is a quick ratio of 4.
Operational Analysis
The commentary above has been focussed on the analysis of churn, not its prediction. But in reasonably efficient markets, understanding how churn might change is potentially the point of value add.
One way of doing this is to understand how valuable customers find the product. In SaaS terms, this is often referred to as the North Star:
“MRR is the price that the customer pays, the North Star is the value that they get.”
The North Star metric will be different for each company, but it needs to show customer engagement with a product. If customers are engaging with a product, this is a good indication of the value they are receiving and therefore a good indication of their willingness to start or keep paying for it. Having customers is not sustainable if those customers don’t use (or like) the product. In addition to providing signals regarding churn, North Star metrics might also provide good insights into the ability of companies to increase prices.
